
Foreword
This article contains consistent examples of all TOGAF diagrams for the four architectural domains.
After many years as a TOGAF practitioner, I have to say that it's a lot that can be improved in the framework, that often remains vague and some time is inconsistent. In the TOGAF specs, some of the metamodel elements are well described while others are left to our best judgment. The DAF metamodel is a tailored version of the TOGAF one, implemented as UML profile and maintained in Sparx Enterprise Architect.
Those examples are the result of real life use of TOGAF in projects: you may or may not use them for the the sake of the TOGAF certification exams.
About the Business Case
The following diagrams are based on the EuroCom business case.
This is non-existing, profit-oriented company working in the mobile telecommunication sector that offers Maintenance Contracts and Support Contracts to Customers .
Their main business is the maintenance and repair of Cellular telephony Modules which are built into Transmitters. Those transmitters are owned by EuroCom customers that are telecomunication companies. A high degree of field work is typical for this sector. A complete description of the business case will be available soon.
Meta-model

Meta-model example

TOGAF
PHASE A
Solution Concept Diagram

A solution concept diagram provides a high-level orientation of the solution that is envisaged in order to meet the objectives of the architecture engagement. In contrast to the more formal and detailed architecture diagrams developed in the following phases, the solution concept represents a pencil sketch of the element involved in the expected solution at the outset of the engagement. This diagram may embody key objectaives, requirements and constraints for the engagement, and also highlight work areas to be investigated in more detail with formal architecture modeling. The purpose of this diagram is to quickly on-board and align stakeholders for a particular change initiative, so that all participants understand what the architecture engagement is seeking to achieve and how it is expected that a particular solution approach will meet the needs of the enterprise.
Value Chain Diagram
A value chain is a set of activities that a firm operating in a specific industry performs in order to deliver a valuable product or service for the market. The idea of the value chain is based on the process view of organizations, the idea of seeing a manufacturing (or service) organization as a system, made up of subsystems each with inputs, transformation processes and outputs. Inputs, transformation processes, and outputs involve the acquisition and consumption of resources – money, labour, materials, equipment, buildings, land, administration and management. How value chain activities are carried out determines costs and affects profits.
This version of the value chain is expressed using the concept of Business capabilities.

This version of the value chain is expressed using the concept of Business capabilities.

PHASE B
Goal/Objective/Service diagram

The purpose of a Goal/Objective/Service diagram is to define the ways in which a service contributes to the achievement of a business vision or strategy.
Services are associated with the drivers, goals, objectives, and measures that they support, allowing the enterprise to understand which services contribute to similar aspects of business performance. The Goal / Objective/ Service diagram also provides qualitative input on what constitutes high performance for a particular service.
Organization Decomposition diagram

An organization map should provide a chain of command of owners and decision-makers in the organization. Although it is not the intent of the Organization Decomposition diagram to link goal to organization, it should be possible to intuitively link the goals to the stakeholders from the Organization Decomposition diagram.
Business footprint diagram

A business footprint diagram describes the links between business goals, organizational units, business functions and services, and maps these functions to the technical components delivering the required capability.
A business footprint diagram provides clear traceability between a technical component and the business goal that it satisfies, whilst also demonstrating ownership of the services identified.
A business footprint diagram demonstrates only the key facts linking organization unit functions to delivery services, and is utilized as a communication platform for senior-level (CxO) stakeholders. It must be focused on the current business interest: depending on the focus, it can concentrate on one or several application components (that need evolution) or on one or more business functions.

Product Lyfecycle Diagram

- This assists in understanding the lifecycles of key entities within the enterprise.
- Understanding product lifecycles is becoming increasingly important with respect to environmental concerns, legislation, and regulation where products must be tracked from manufacture to disposal.
- Equally, organizations that create products that involve personal or sensitive information must have a detailed understanding of the product life-cycle during the development of Business Architecture in order to ensure rigor in design of controls, processes, and procedures.
- Examples of this include credit cards, debit cards, store/loyalty cards, smart cards, user identity credentials (identity cards, passports, etc.).
Business service/information diagram
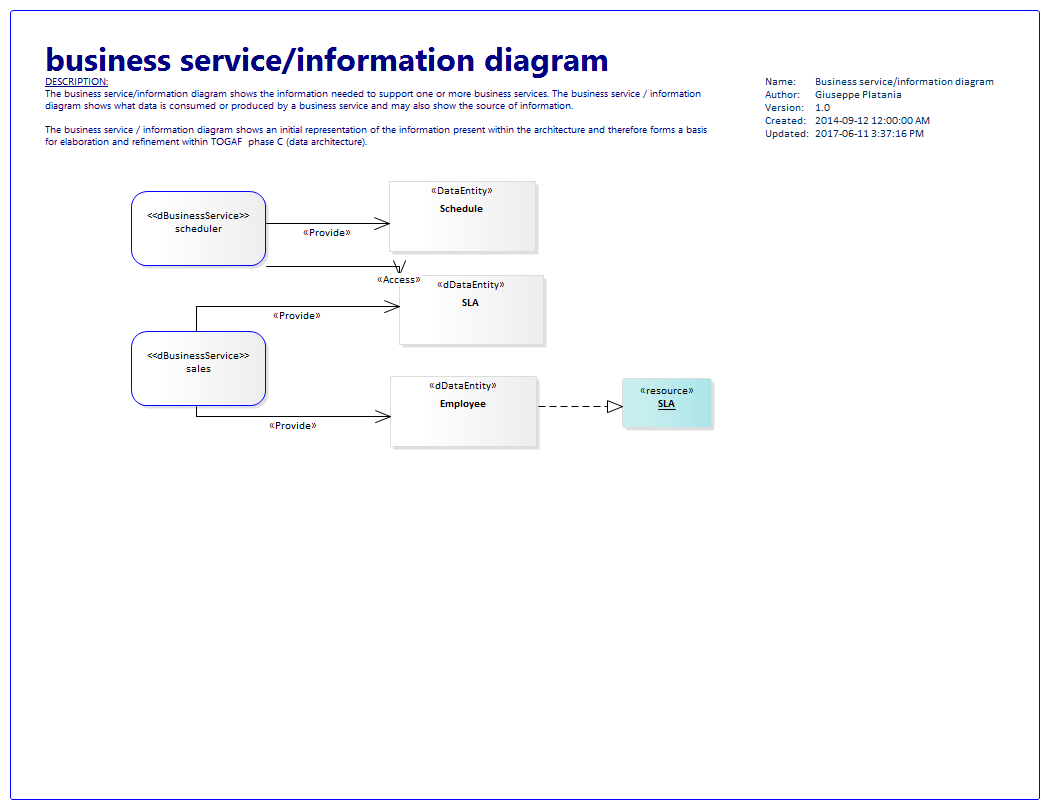
The business service/information diagram shows the information needed to support one or more business services. The business service / information diagram shows what data is consumed or produced by a business service and may also show the source of information.
The business service / information diagram shows an initial representation of the information present within the architecture and therefore forms a basis for elaboration and refinement within TOGAF phase C (data architecture).
functional decomposition diagram

the purpose of the functional decomposition diagram is to show on a single page the capabilities of an organization that are relevant to the consideration of an architecture. By examining the capabilities of an organization from a functional perspective, it is possible to quickly develop models of what the organization does without being dragged into an extended debate on how the organization does it. Once a basic functional decomposition diagram has been developed, it becomes possible to consolidate To-be Business functions and services.


Process Flow Diagram

The purpose of the Process Flow diagram is to depict all models and mappings related to the process metamodel entity. Process Flow diagrams show sequential flow of control between activities and may utilize swimlane techniques to represent ownership and realization of process steps. For example, the application that supports a process step may be shown as a swim-lane.
In addition to showing a sequence of activity, process flows can also be used to detail the controls that apply to a process, the events that trigger or result from completion of a process, and also the products that are generated from process execution.
Process Flow diagrams are useful in elaborating the architecture with subject specialists, as they allow the specialist to describe ‘‘how the job is done’’ for a particular function. Through this process, each process step can become a more fine-grained function and can then in turn be elaborated as a process.
Business Use Case Diagram

A Business Use-Case diagram displays the relationships between consumers and providers of business services. Business services are consumed by actors or other business services and the Business Use-Case diagram provides added richness in describing business capability by illustrating how and when that capability is used.
The purpose of the Business Use-Case diagram is to help to describe and validate the interaction between actors and their roles to processes and functions. As the architecture progresses, the use-case can evolve from the business level to include data, application, and technology details. Architectural business use-cases can also be re-used in systems design work.
Event Diagram

Also called "process maps".
The purpose of the Event diagram is to depict the relationship between events and process.
Certain events — such as arrival of certain information (e.g., customer submits sales order) or a certain point in time (e.g., end of fiscal quarter) — cause work and certain actions need to be under taken within the business. These are often referred to as ‘‘business events’’ or simply ‘‘events’’ and are considered as triggers for a process. It is important to note that the event has to trigger a process and generate a business response or result.
Phase C : Data
Conceptual Data diagram

The key purpose of the Conceptual Data diagram is to depict the relationships between critical data entities within the enterprise. This diagram is developed to address the concerns of business stakeholders.
Techniques used include:
- Entity relationship models
- Simplified UML class diagrams
Data Dissemination diagram

The purpose of the Data Dissemination diagram is to show the relationship between data entity, business service, and application components. The diagram shows how the logical entities are to be physically realized by application components. This allows effective sizing to be carried out and the IT footprint to be refined. Moreover, by assigning business value to data, an indication of the business criticality of application components can be gained.
Additionally, the diagram may show data replication and application ownership of the master reference for data. In this instance, it can show two copies and the master-copy relationship between them. This diagram can include services; that is, ser vices encapsulate data and they reside in an application, or services that reside on an application and access data encapsulated within the application.
Logical Data diagram

The key purpose of the Logical Data diagram is to show logical views of the relationships between critical data entities within the enterprise. This diagram is developed to address the concerns of:
- Application developers
- Database designers
Data Lifecycle diagram

The Data Lifecycle diagram is an essential part of managing business data throughout its
lifecycle from conception until disposal within the constraints of the business process.
The data is considered as an entity in its own right, decoupled from business process and
activity. Each change in state is represented on the diagram which may include the event or rules that trigger that change in state.
The separation of data from process allows common data requirements to be identified which enables resource sharing to be achieved more effectively.
Data Security diagram

The purpose of the Data Security diagram is to depict which actor (person, organization, or system) can access which enterprise data. This relationship can be shown in a matrix form between two objects or can be shown as a mapping.
The diagram can also be used to demonstrate compliance with data privacy laws and other applicable regulations (HIPAA, SOX, etc). This diagram should also consider any trust implications where an enterprise’s partners or other parties may have access to the company’s systems, such as an outsourced situation where information may be managed by other people and may even be hosted in a different country.
Data Migration diagram

Data migration is critical when implementing a package or packaged service-based solution.
This is particularly true when an existing legacy application is replaced with a package or an enterprise is to be migrated to a larger packages/packaged services footprint. Packages tend to have their own data model and during data migration the legacy application data may need to be transformed prior to loading into the package.
Data migration activities will usually involve the following steps:
- Extract data from source applications (baseline systems)
- Profile source data
- Perform data transformation operations, including data quality processes:
- Standardize, normalize, de-duplicate source data (data cleansing)
- Match, merge, and consolidate data from different source(s)
- Source-to-target mappings
- Load into target applications (target systems)
PHASE C: Application
Application Communication Diagram

The purpose of the Application Communication diagram is to depict all models and mappings related to communication between applications in the metamodel entity.
It shows application components and interfaces between components. Interfaces may be associated with data entities where appropriate. Applications may be associated with business services where appropriate. Communication should be logical and should only show intermediary technology where it is architecturally relevant.
metamodel element used:
Application component
Provided services: Access points to application components through provided services.
Required services: Required services of application components need to be connected to provided services by other components.
Connector: Used between provided or required services, and or instances of application components.
Information flow: Defines the flow of any kind of information (business entity, event, product, informal, etc.) between active entities of the enterprise. Flow link between data (e.g. business entity, event, product) and active elements (e.g. business process, service).
External actor: An actor that is external to the enterprise
Consumes link: Expresses that a participant (e.g. actor) consumes an element of the IS (service, operation, application component).
Application and User Location diagram

The Application and User Location diagram shows the geographical distribution of applications.
It can be used to show where applications are used by the end user; the distribution of where the host application is executed and/or delivered in thin client scenarios; the distribution of where applications are developed, tested, and released; etc.
Analysis can reveal opportunities for rationalization, as well as duplication and/or gaps.
The purpose of this diagram is to clearly depict the business locations from which business users typically interact with the applications, but also the hosting location of the application infrastructure.
The diagram enables:
- Identification of the number of package instances needed to sufficiently support the user population that may be spread out geographically
- Estimation of the number and the type of user licenses for the package or other software
- Estimation of the level of support needed for the users and location of support center
- Selection of system management tools, structure, and management system required to support the enterprise users/customers/partners both locally and remotely
- Appropriate planning for the technological components of the business, namely server
- sizing and network bandwidth, etc.
- Performance considerations while implementing application and technology architecture solutions
Users typically interact with applications in a variety of ways; for example:
- To support the operations of the business day-to-day
- To participate in the execution of a business process
- To access information (look-up, read)
- To develop the application
- To administer and maintain the application
Application Use-Case diagram

An Application Use-Case diagram displays the relationships between consumers and providers of application services. Application services are consumed by actors or other application ser vices and the Application Use-Case diagram provides added richness in describing application functionality by illustrating how and when that functionality is used.
The purpose of the Application Use-Case diagram is to help to describe and validate the interaction between actors and their roles with applications. As the architecture progresses, the use-case can evolve from functional information to include technical realization detail.
Application use-cases can also be re-used in more detailed systems design work.
Software Engineering diagram

The Software Engineering diagram breaks applications into packages, modules, ser vices, and operations from a development perspective.
It enables more detailed impact analysis when planning migration stages, and analyzing opportunities and solutions. It is ideal for application development teams and application management teams when managing complex development environments.
Process/Application Realization

The purpose of the Process/Application Realization diagram is to clearly depict the sequence of events when multiple applications are involved in executing a business process.
It enhances the Application Communication diagram by augmenting it with any sequencing constraints, and hand-off points between batch and real-time processing.
It would identify complex sequences that could be simplified, and identify possible rationalization points in the architecture in order to provide more timely information to business users. It may also identify process efficiency improvements that may reduce interaction traffic between applications.
Application Migration diagram

The Application Migration diagram identifies application migration from baseline to target application components. It enables a more accurate estimation of migration costs by showing precisely which applications and interfaces need to be mapped between migration stages.
It would identify temporary applications, staging areas, and the infrastructure required to support migrations (for example, parallel run environments, etc).
Enterprise Manageability diagram

The Enterprise Manageability diagram shows how one or more applications interact with application and technology components that support operational management of a solution.
This diagram is really a filter on the Application Communication diagram, specifically for enterprise management class software.
Analysis can reveal duplication and gaps, and opportunities in the IT service management operation of an organization.

The Software Distribution diagram shows how application software is structured and distributed across the estate. It is useful in systems upgrade or application consolidation projects.
This diagram shows how physical applications are distributed across physical technology and the location of that technology.
This enables a clear view of how the software is hosted, but also enables managed operations staff to understand how that application software is maintained once installed.
Software Distribution diagram

The Software Distribution diagram shows how application software is structured and distributed across the estate. It is useful in systems upgrade or application consolidation projects.
This diagram shows how physical applications are distributed across physical technology and the location of that technology.
This enables a clear view of how the software is hosted, but also enables managed operations staff to understand how that application software is maintained once installed.
PHASE D: Technology
Environments and Locations Diagram

The Environments and Locations diagram depicts which locations host which applications, identifies what technologies and/or applications are used at which locations, and finally identifies the locations from which business users typically interact with the applications.
This diagram should also show the existence and location of different deployment environments, including non-production environments, such as development and pre production.
Platform Decomposition Diagram

The Platform Decomposition diagram depicts the technology platform that supports the operations of the Information Systems Architecture. The diagram covers all aspects of the infrastructure platform and provides an overview of the enterprise's technology platform. The diagram can be expanded to map the technology platform to appropriate application components within a specific functional or process area. This diagram may show details of specification, such as product versions, number of CPUs, etc. or simply could be an informal "eye-chart" providing an overview of the technical environment.
The diagram should clearly show the enterprise applications and the technology platform for each application area can further be decomposed as follows:
- Hardware:
- Logical Technology Components (with attributes)
- Physical Technology Components (with attributes)
- Software:
- Logical Technology Components (with attributes)
- Physical Technology Components (with attributes)
Depending upon the scope of the enterprise architecture work, additional technology cross-platform information (e.g., communications, telco, and video information) may be addressed.
Processing Diagram

The Processing diagram focuses on deployable units of code/configuration and how these are deployed onto the technology platform. A deployment unit represents grouping of business function, service, or application components. The Processing diagram addresses the following:
- Which set of application components need to be grouped to form a deployment unit
- How one deployment unit connects/interacts with another (LAN, WAN, and the applicable protocols)
- How application configuration and usage patterns generate load or capacity requirements for different technology components
The organization and grouping of deployment units depends on separation concerns of the presentation, business logic, and data store layers and service-level requirements of the components. For example, presentation layer deployment unit is grouped based on the following:
- Application components that provide UI or user access functions
- Application components that are differentiated by location and user roles
There are several considerations to determine how application components are grouped together. Each deployment unit is made up of sub-units, such as:
- Installation: Part that holds the executable code or package configuration (in case of packages).
- Execution: Application component with its associated state at run time.
- Persistence: Data that represents the persistent state of the application component.
Finally, these deployment units are deployed on either dedicated or shared technology components (workstation, web server, application server, or database server, etc.). It is important to note that technology processing can influence and have implications on the services definition and granularity.
Networked Computing/Hardware Diagram

Starting with the transformation to client-server systems from mainframes and later with the advent of e-Business and J2EE, large enterprises moved predominantly into a highly network-based distributed network computing environment with firewalls and demilitarized zones. Currently, most of the applications have a web front-end and, looking at the deployment architecture of these applications, it is very common to find three distinct layers in the network landscape; namely a web presentation layer, an business logic or application layer, and a back-end data store layer. It is a common practice for applications to be deployed and hosted in a shared and common infrastructure environment.
So it becomes highly critical to document the mapping between logical applications and the technology components (e.g., server) that supports the application both in the development and production environments. The purpose of this diagram is to show the "as deployed" logical view of logical application components in a distributed network computing environment. The diagram is useful for the following reasons:
- Enable understanding of which application is deployed where in the distributed network computing environment
- Establishing authorization, security, and access to these technology components
- Understand the Technology Architecture that support the applications during problem resolution and troubleshooting
- Isolate performance problems encountered by applications, determine whether it is application code-related or technology platform-related, and perform necessary upgrade to specific physical technology components
- Identify areas of optimization as and when newer technologies are available which will eventually reduce cost
- Enable application/technology auditing and prove compliance with enterprise technology standards
- Serve as an important tool to introduce changes to the Technology Architecture, thereby supporting effective change management
- Establish traceability and changing application end-point address while moving application either from a shared environment to a dedicated environment or vice versa
The scope of the diagram can be appropriately defined to cover a specific application, business function, or the entire enterprise. If chosen to be developed at the enterprise level, then the network computing landscape can be depicted in an application agnostic way as well.
Communications Engineering Diagram

The Communications Engineering diagram describes the means of communication - the method of sending and receiving information - between these assets in the Technology Architecture; insofar as the selection of package solutions in the preceding architectures put specific requirements on the communications between the applications.
The Communications Engineering diagram will take logical connections between client and server components and identify network boundaries and network infrastructure required to physically implement those connections. It does not describe the information format or content, but will address protocol and capacity issues.
Phase E: Opportunities and Solutions
Benefits diagram

The Benefits diagram shows opportunities identified in an architecture definition, classified according to their relative size, benefit, and complexity. This diagram can be used by stakeholders to make selection, prioritization, and sequencing decisions on identified opportunities.
Project Context diagram

A Project Context diagram shows the scope of a work package to be implemented as a part of a broader transformation roadmap. The Project Context diagram links a work package to the organizations, functions, services, processes, applications, data, and technology that will be
added, removed, or impacted by the project.
The Project Context diagram is also a valuable tool for project portfolio management and project mobilization.
added, removed, or impacted by the project.
The Project Context diagram is also a valuable tool for project portfolio management and project mobilization.
Comments
EA is all the work you have to do BEFORE you start executing projects.
If you want to learn a proper EA framework, I suggest a Pragmatic EA Framework (PEAF)..
If you want to know more about PEAF (and POET) there are various ways (from FREE to paid)…
FREE
====
- Read all our books online for FREE www.issuu.com/Pragmatic-EA
- Sign up for a FREE license www.PragmaticEA.com/licensing-non-commercial.asp
- Enrol on a FREE self-study certification course www.PragmaticEA.com/training.asp
PAID
====
- Buy hard copies of our books www.PragmaticEA.com/Books
- Enrol on face-to-face certification courses and workshops www.PragmaticEA.com/training-courses.asp
- Engage us on a consultancy basis www.PragmaticEC.com
ALSO
====
- See how PEAF is licensed to be used all over the world www.PragmaticEA.com/licensing.asp
- See what makes PEAF credible www.PragmaticEA.com/credibility.asp
NSDM Academy
togaf training and certification
Architecture Modeling
Architecture Modeling in USA
Architecture Modeling in UK
Architecture Modeling in USA
You can contact them for a loan request on pedroloanss@gmail.com And WhatsApp + 1-8632310632